Tableau Dashboard
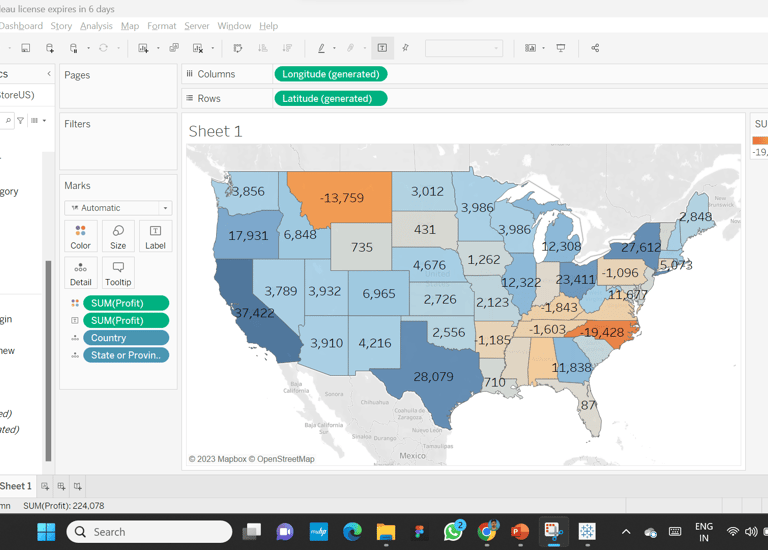
We created an interactive dashboard using Tableau to show sales and profit margins for each state in the USA. This dashboard makes it easy to analyze important data and see how each state is performing. Users can explore different states and compare their sales figures and profit margins. With clear visuals and easy-to-understand charts, the dashboard helps businesses make informed decisions and find areas for improvement. Overall, it’s a useful tool for anyone looking to understand sales performance across the country.
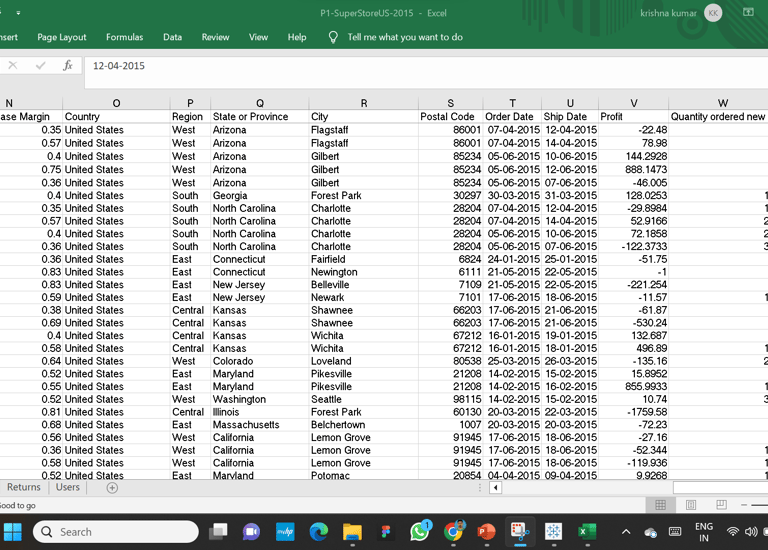
Data Gathering
Data Gathering from various source systems
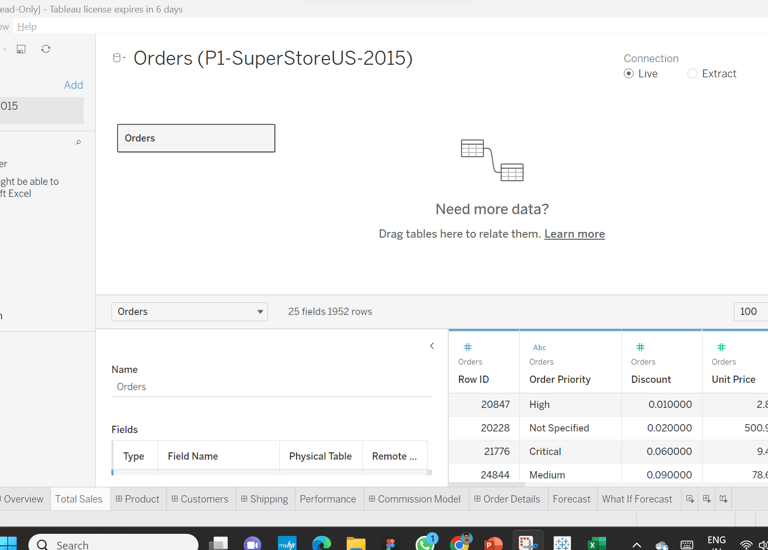
Data Mapping
Mapping the different source data with common key factors
Insights Projection
Insights projection refers to the process of analyzing, understanding, and interpreting data in order to discover valuable insights and patterns that can then be used to make informed decisions.
Project title
Contact
Phone
krishhh1991@gmail.com
+61-455435496
© 2025. All rights reserved.
LOCATION
East Perth, WA-6004