Alteryx Project
In the realm of data analytics, Alteryx stands out as a powerful tool for processing big data through its intuitive workflow-based interface. By utilizing a drag-and-drop framework, Alteryx allows users to construct complex data processes visually, thereby circumventing the need for intricate coding. The workflow design leverages an array of tools that perform tasks such as data preparation, blending, and advanced analytics with efficiency and precision. This modular approach not only facilitates seamless integration of diverse datasets but also enables rapid iteration and prototyping. The scalability of Alteryx workflows ensures they can handle large volumes of data while maintaining performance integrity. As users develop these workflows in Alteryx Designer, they benefit from real-time feedback on operations, allowing for immediate adjustments that optimize outcomes. Furthermore, the platform's robust community support enriches user knowledge and fosters collaborative problem-solving in an ever-evolving data landscape.
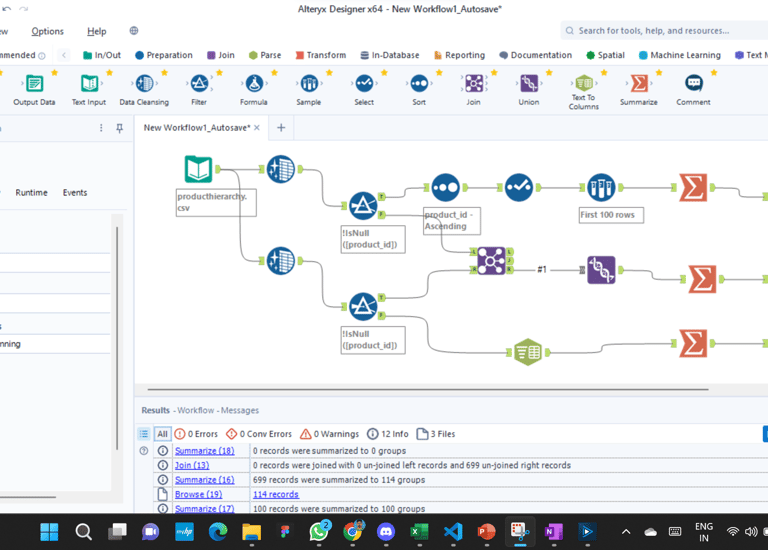
Explore the the source system data
Automated Queries Update
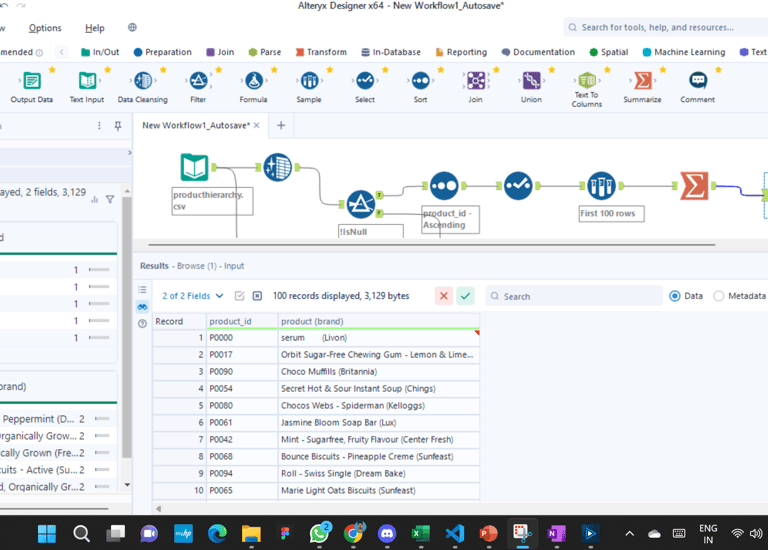
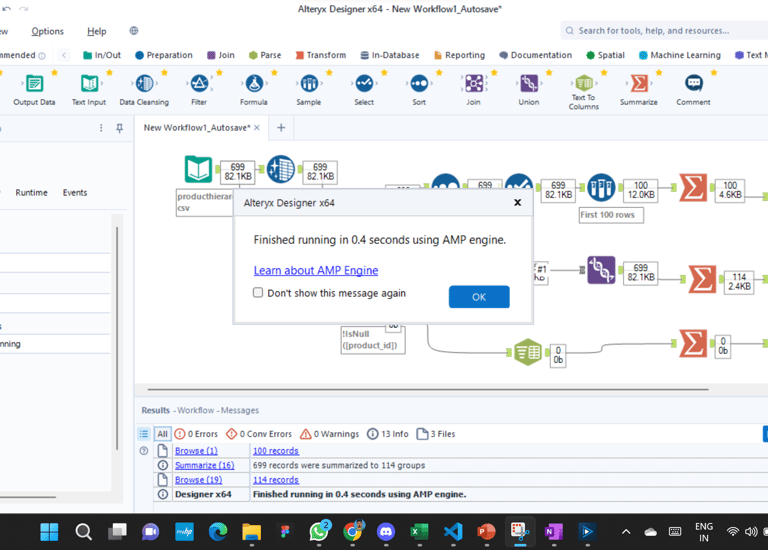
The big source system data is organized and split with queries and for the processing the requirement without disturbing the source data raw file
The automated queries will process and produce the output in the storage location
Output Data Analysis
The output data can be visualized and can be routed to other system for processing data visualizations
Contact
Phone
krishhh1991@gmail.com
+61-455435496
© 2025. All rights reserved.
LOCATION
East Perth, WA-6004