professional Portfolio of krish
Data Analysis & Insights projection using Power BI
Microsoft Power BI is a cloud-based business analytics tool that allows users to analyze data from various sources to make data-driven decisions. Here are some things you can do with Power BI:
Visualize data: Create interactive dashboards and reports to visualize data in real time.
Explore data: Use automated queries and data exploration options to discover insights from data.
Analyze data: Filter and slice data for deeper analysis, and create calculated columns and measures with DAX.
Share data: Share reports and dashboards with colleagues to promote collaboration.
Integrate with other tools: Power BI integrates with other Microsoft tools like Excel, SharePoint, and Azure.
Connect to data sources: Connect to a wide range of data sources, including databases, spreadsheets, cloud services, and web APIs.
Use natural language queries: Use natural language queries to analyze data.
Schedule automated refreshes: Schedule automated refreshes for reports
Project Description
The sales report of 3 consecutive years were used to create the Power BI Interactive Dashboard
The steps followed in the process.
Merged all 3 sales reports using their common factors
Used the required data and masking the remaining data
Used ETL logic, Data Mapping and finally Insights Projection are created with various effective charts.
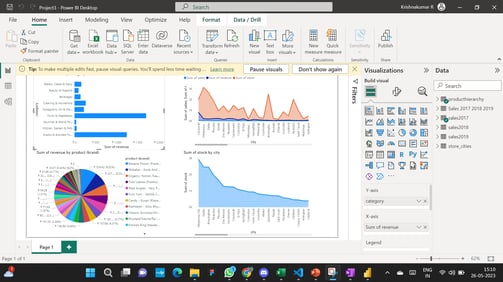
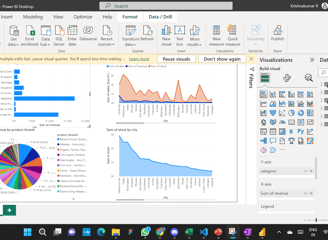
Project - Sales data insights projection
(Please click on the below image to see the full screen view)
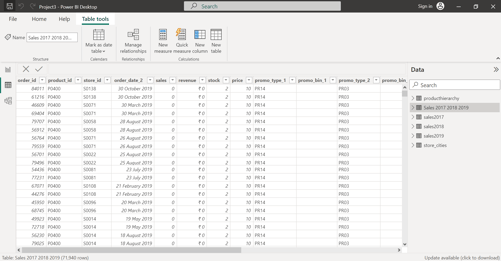
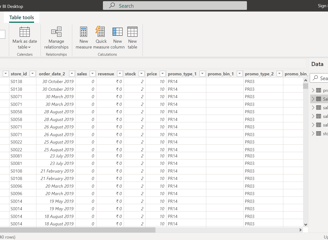
ETL (Extract, Transform & Loading)
It is a process used in data integration and management to extract data from various sources, transform the data into a suitable format, and then load it into a target destination.
Insights Projection
→
→
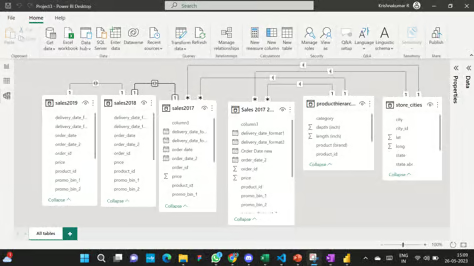
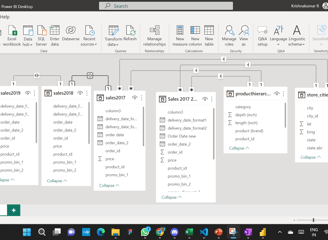
Data Mapping
Data mapping is the process of matching fields from one data source to another, ensuring that the data is accurately transferred and transformed between the two systems which is source system and the target system.
Insights projection refers to the process of analyzing, understanding, and interpreting data in order to discover valuable insights and patterns that can then be used to make informed decisions.
(Please click on the below image to see the full screen view)
